

Frequency and interval recording are two of the simplest ways to turn “he does it all the time” into numbers a team can actually use. Picture a second-grade reading block where one student calls out again and again, while another drifts off task for long stretches. Both students worry the teacher, yet the two behaviors need very different kinds of data.
This guide gives you a five-step process: define the behavior, choose the right method, set up a short observation, record it without losing your lesson, and turn the numbers into a decision. By the end, you will know when to count, when to use intervals, and how to pair either one with ABC notes so the team sees both how often and why.
Examples are fictional. Adapt to the student’s goals and agreed supports. This is guidance, not a diagnosis.
At a glance
- Start with a clear, observable definition of one behavior.
- Count behaviors that have a clear start and end and happen in short bursts.
- Use intervals for behaviors that last a while or happen too fast to count.
- Keep observations short, at the same time of day, and on the same form.
- Add ABC notes so the numbers come with context.
1. Define the behavior before frequency and interval recording
First, decide exactly what you will record. Frequency and interval recording only work when two adults watching the same student would mark the same thing. So, write a definition that describes what the behavior looks like and sounds like, not what you think the student feels.
For example, “disruptive” is too vague. “Speaks an answer or comment aloud during whole-group instruction without being called on” is clear. Similarly, “off task” becomes “eyes and body not directed at the assigned material for more than a few seconds, such as looking around, playing with objects, or putting head down.”
Next, add one or two examples and non-examples. This step feels slow, but it saves arguments later. If a substitute or paraprofessional collects data, they need the same picture you have.
| Vague label | Observable definition |
|---|---|
| Disruptive | Calls out without being called on |
| Off task | Eyes and body away from assigned work |
| Aggressive | Hits, kicks, or pushes another person |
| Wanders | Leaves assigned area without permission |
Worked example. Jonah is a fictional student in grade 2. His teacher’s first note says “Jonah is disruptive in reading.” After rewriting, she has two separate behaviors: calling out during the read-aloud, and being off task during independent reading. Each one now needs its own method.
In short, one clear definition per behavior is the foundation of any data plan. Without it, even careful frequency and interval recording will give you numbers that nobody trusts.
2. Choose frequency or interval recording for the behavior
Once the behavior is defined, pick the method that fits its shape. This is the step where most data plans go wrong, so take a minute to think about how the behavior actually happens.
Frequency recording means counting each time the behavior occurs during a set period. It works best for behaviors with a clear beginning and end that are short, such as calling out, hitting, or raising a hand. If you observe for different lengths of time on different days, convert the count to a rate, such as times per 10 minutes, so days can be compared.
Interval recording means dividing the observation into equal short intervals and marking whether the behavior happened. It works best for behaviors that last a while or happen so quickly that counting is unrealistic, such as being off task, humming, or rocking. In partial interval recording, you mark the interval if the behavior happened at any point. In whole interval recording, you mark it only if the behavior lasted the entire interval. Momentary time sampling, a close cousin, checks only at the exact end of each interval.
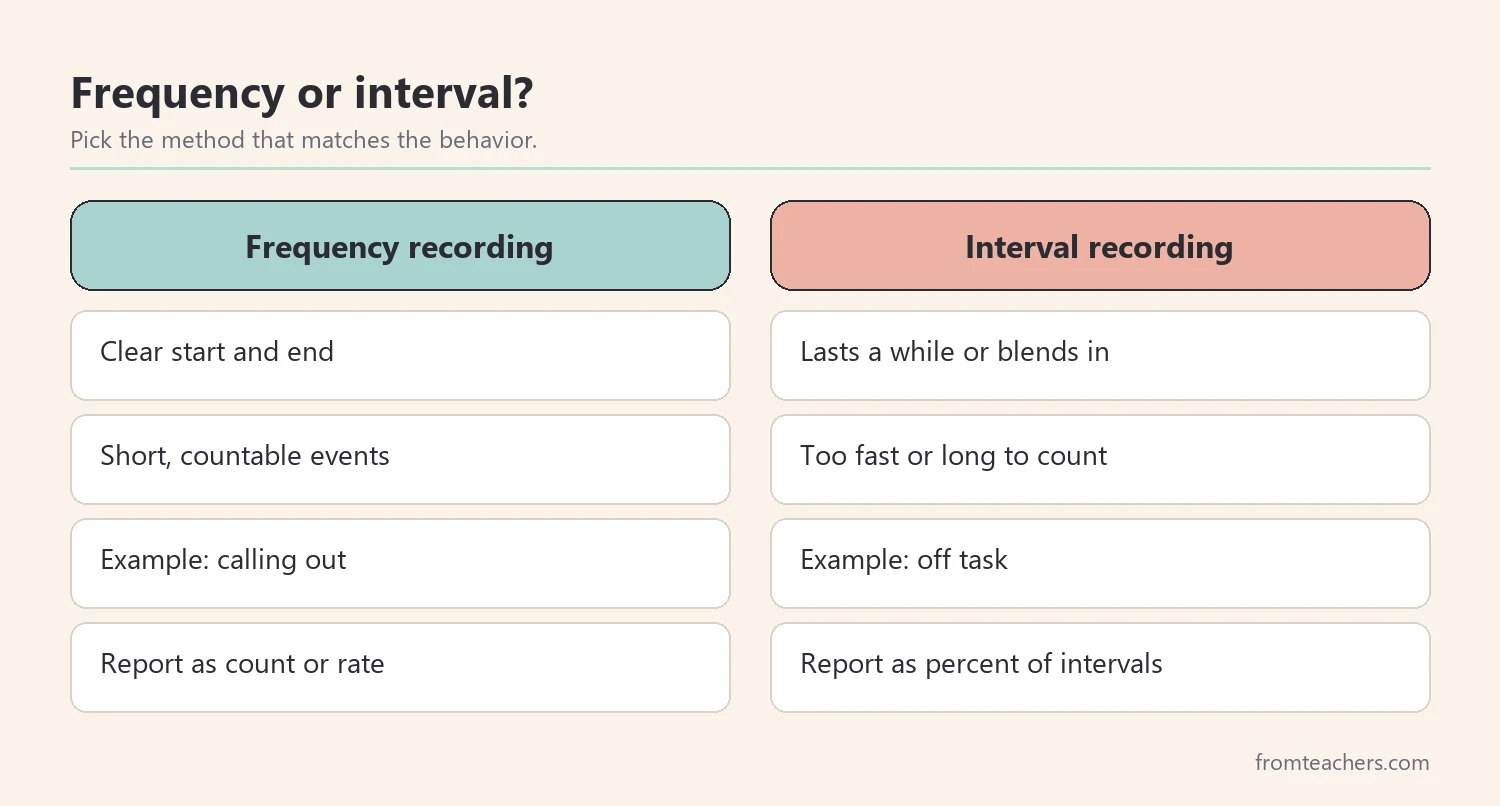
Also, remember that each method has limits. Partial interval recording tends to overestimate how much a behavior happens, while whole interval recording tends to underestimate it. Neither is wrong, but you should use the same version every time so the trend is fair.
Quick math for fair comparisons
Because sessions are rarely identical, a little math keeps frequency and interval recording honest. For frequency, divide the count by the minutes observed, then multiply by 10 to get a rate per 10 minutes. For example, 6 call-outs in 20 minutes is 3 per 10 minutes, and 6 call-outs in 30 minutes is 2 per 10 minutes.
For intervals, divide the marked intervals by the intervals actually observed, then multiply by 100. For instance, 5 marked out of 20 observed is 25 percent. If 2 of those 20 were missed, the math becomes 5 out of 18, or about 28 percent. As a result, every session uses the same yardstick.
Worked example. Jonah’s calling out is short and easy to see, so his teacher chooses frequency. His off-task behavior lasts several seconds to minutes and blends into other actions, so she chooses partial interval recording with one-minute intervals.
3. Set up a short, repeatable observation
Good data comes from a routine, not from heroic effort, and frequency and interval recording are no exception. Therefore, set up observations that are short, happen at the same time of day, and use the same form each time. Consistency matters more than length in frequency and interval recording.
Choose the activity where the behavior is most likely or most important. Then, pick a length you can keep up: 15 to 30 minutes for frequency, and 10 to 20 minutes for intervals is often realistic in a busy classroom. For intervals, choose an interval length short enough to catch the behavior. Many teachers use 30 seconds, one minute, or two minutes.
Next, prepare the form before the lesson. A frequency log needs the date, start and end time, a space for tally marks, and the total. An interval sheet needs a numbered grid, one box per interval. A vibrating timer or a simple interval app helps you know when each box ends without watching the clock.
Setup checklist
- One behavior, one definition, one method.
- Same activity and time of day each session.
- Observation length written at the top of the form.
- Interval length chosen and timer ready, if using intervals.
- Space for a short note about anything unusual.
If you would rather not build these sheets yourself, the ABC behavior tracking forms with frequency and interval sheets include a frequency log with date, time, and total columns, plus a minute-by-minute interval grid.
Worked example. Jonah’s teacher records calling out during the 20-minute read-aloud on Monday, Wednesday, and Friday. For off-task behavior, she observes the first 20 minutes of independent reading on Tuesday and Thursday, using 20 one-minute intervals and a vibrating timer in her pocket.
4. Record without losing your lesson
Teachers rarely have free hands during frequency and interval recording. So, the fourth step is making frequency and interval recording fit inside real teaching. The goal is accurate enough data, not perfect data.
For frequency, keep a tally where your hands already are. A sticky note on your book, a clicker in your pocket, or moving paper clips from one pocket to the other all work. Write the total on the form as soon as the session ends, while you still remember.
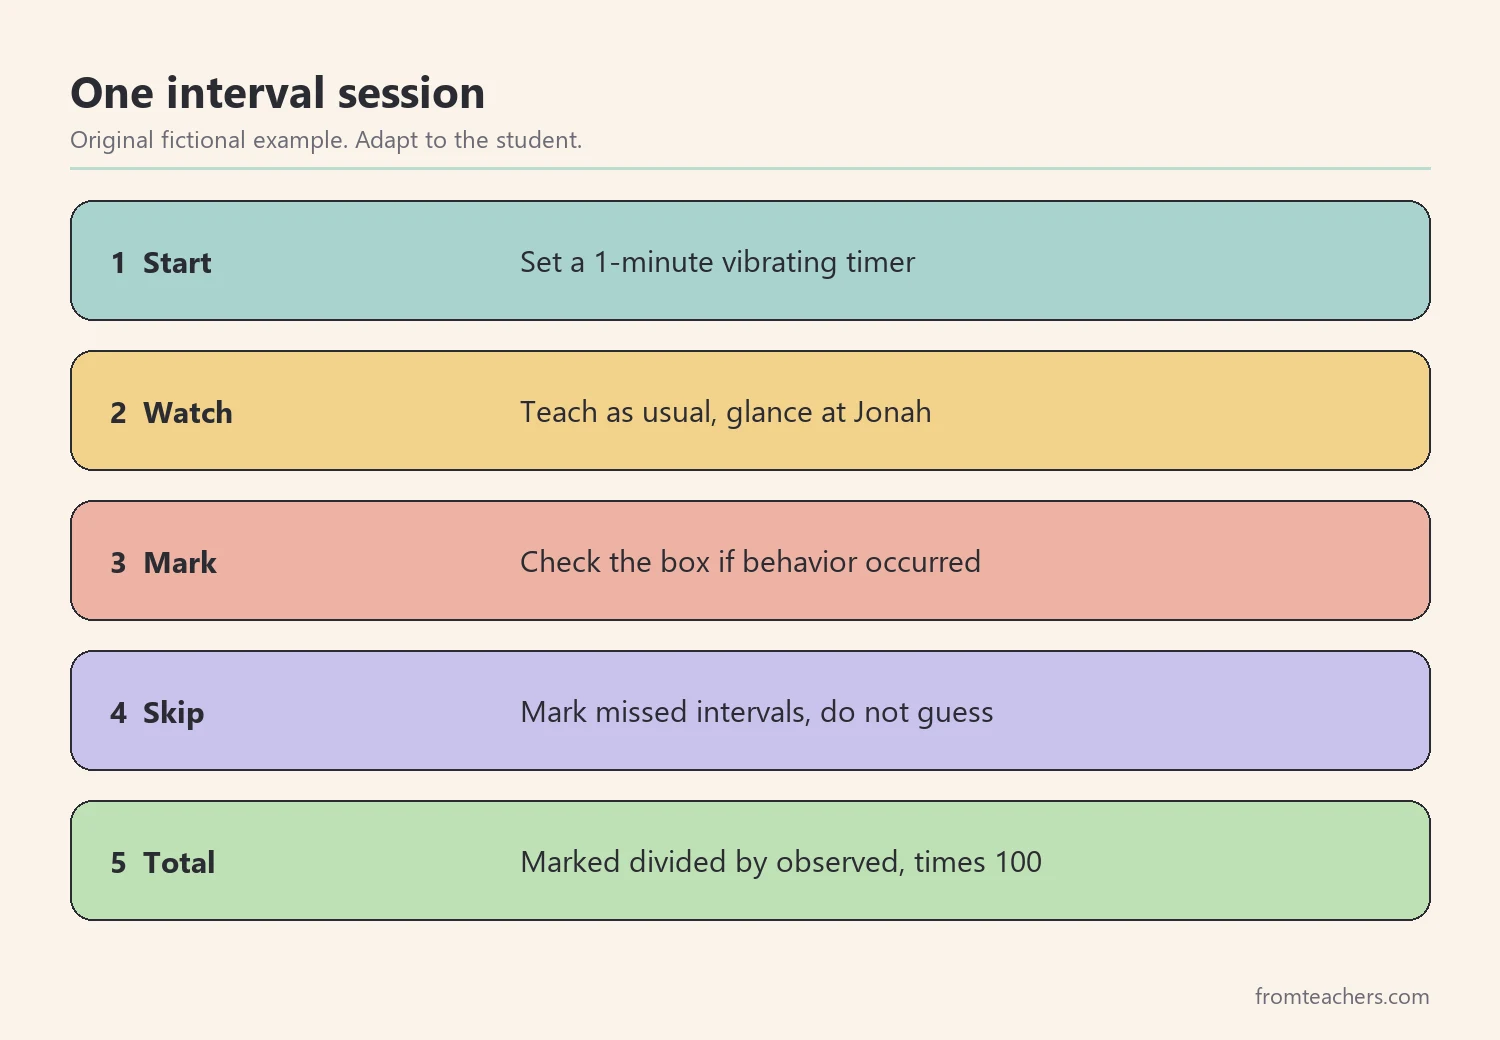
For intervals, the timer does the remembering. When it buzzes, glance at the student, decide whether the behavior happened during that interval, and mark the box. If you miss an interval, mark it as missed rather than guessing, and leave it out of the percentage.
In addition, pair the numbers with a few ABC notes. Frequency and interval recording tell you how often or how much. ABC notes, meaning antecedent, behavior, and consequence, tell you what happened just before and just after. Two or three ABC entries per week are often enough to spot patterns.
Worked example. On Tuesday, Jonah’s teacher records 20 one-minute intervals during independent reading. She marks 8 intervals with off-task behavior and 12 without. That is 8 out of 20, or 40 percent of intervals. Her ABC note shows that 5 of the 8 marked intervals came after Jonah finished his book and had no next step.
5. Turn frequency and interval recording into decisions
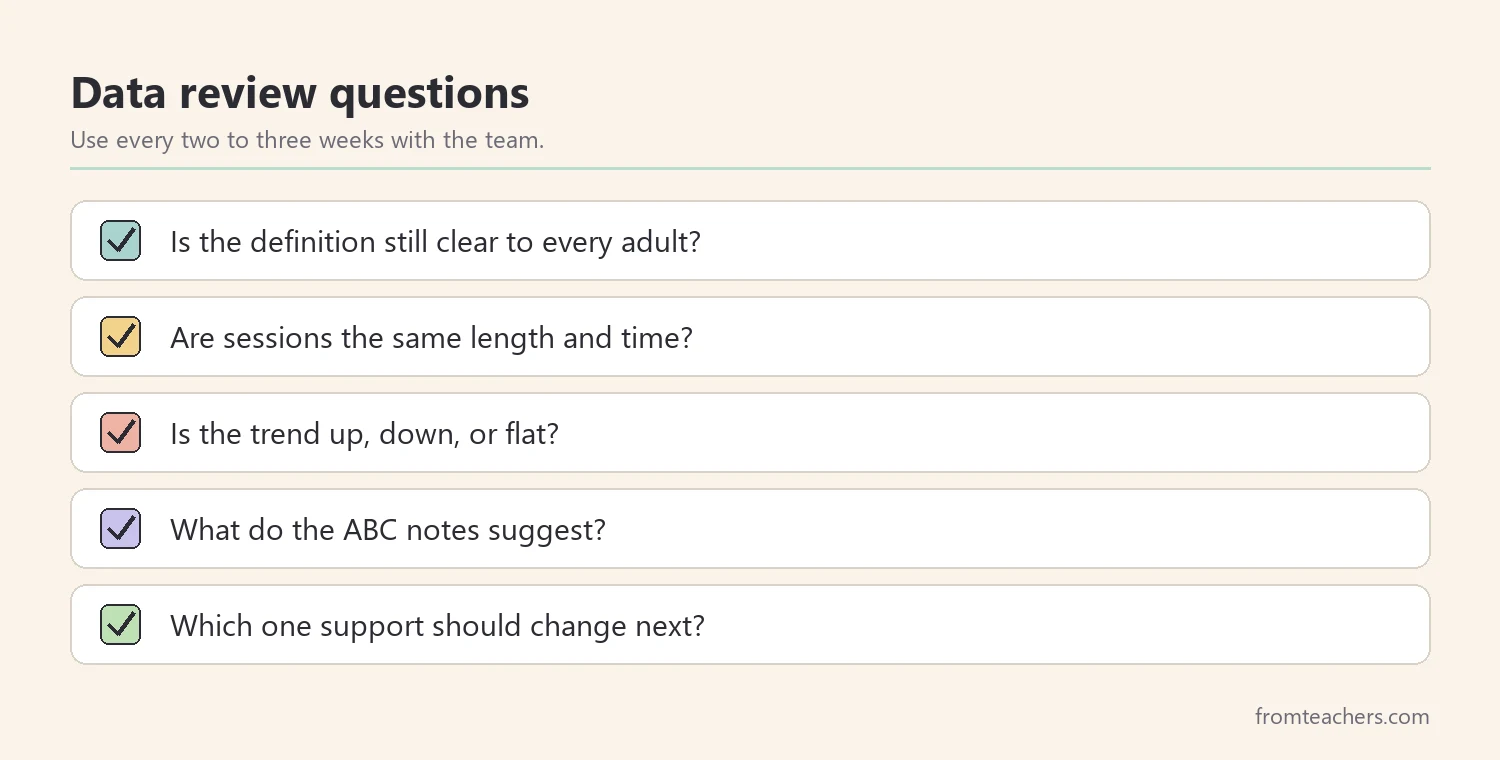
Frequency and interval recording are only useful when someone looks at the results. Therefore, set a short review every two to three weeks, and plot or list the numbers by session. Look for the trend, not one bad day.
For frequency, compare counts or rates across sessions. For intervals, compare percentages. Then, ask a simple question: is the behavior going up, down, or staying flat since the support started? If it is flat after a fair trial, adjust one part of the plan.
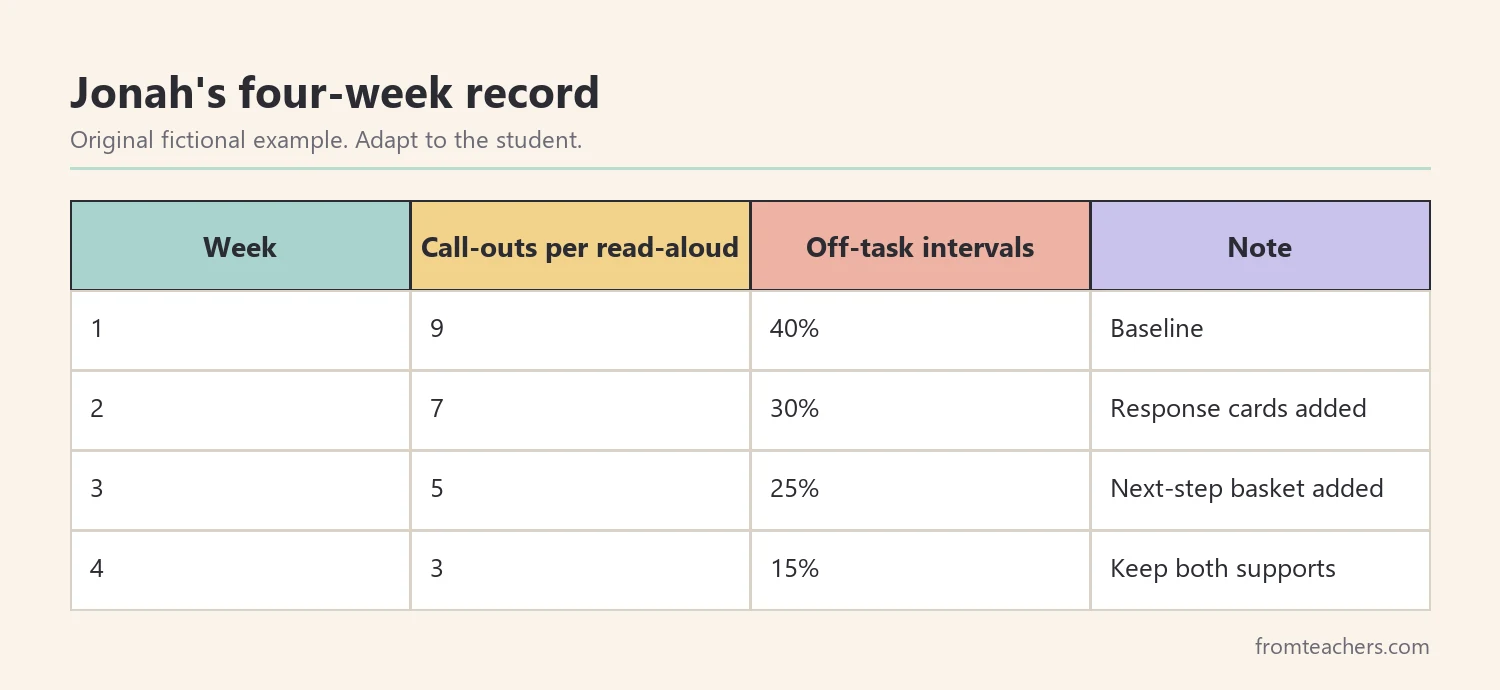
Also, share the results of frequency and interval recording in plain language. Families and team members do not need technical terms to understand “Jonah called out 9 times per read-aloud in week 1 and 3 times in week 4.” For students with an IEP or behavior plan, bring the forms and the summary to meetings so supports can be updated with evidence.
Worked example. After week 1, the team adds response cards for read-aloud questions. After week 2, it adds a “finished book” basket with a next-step card. By week 4, Jonah averages 3 call-outs per read-aloud instead of 9, and his off-task intervals drop from 40 percent to 15 percent. The team keeps both supports and plans to review again in three weeks.
Common mistakes and how to avoid them
- Recording a vague behavior. Different adults mark different things. Fix: write an observable definition with examples and non-examples.
- Counting a long behavior. Frequency hides how long the behavior lasts. Fix: use intervals or duration for behaviors that continue over time.
- Changing session length without converting. Raw counts become unfair to compare. Fix: convert to a rate, such as times per 10 minutes.
- Switching interval types. Partial and whole interval results are not comparable. Fix: pick one and keep it for the whole plan.
- Collecting numbers without context. You see how much but not why. Fix: add a few ABC notes each week.
- Never reviewing the data. Forms pile up unused. Fix: schedule a short review every two to three weeks.
Questions teachers and parents ask about frequency and interval recording
Which is better, frequency or interval recording?
Neither is better in general. Frequency fits short, countable behaviors, and intervals fit behaviors that last or happen too fast to count. Choosing between frequency and interval recording depends on the shape of the behavior.
How many sessions do I need before deciding anything?
There is no fixed rule, but a few sessions before a change and a few after give you a fairer picture than one day. Look for a steady trend rather than a single high or low point.
Can a paraprofessional collect the data?
Yes, and that often helps. Make sure they use the same definition, form, and timing as you, and check together once or twice that you mark the same intervals while watching the same session.
What is the difference between interval recording and momentary time sampling?
Interval recording looks across the whole interval, while momentary time sampling checks only at the exact moment the interval ends. Time sampling is easier during teaching but can miss short behaviors.
Do I still need ABC data if I use frequency and interval recording?
Usually, yes. The counts and percentages show change over time, and ABC notes help explain why the behavior happens. Together, frequency and interval recording plus ABC data give the team a fuller picture.
Related reading: The Power of Data Tracking in Special Education, special education tracking tools, and Moving Beyond Shame and Behavior Charts.
A companion resource for frequency and interval recording:
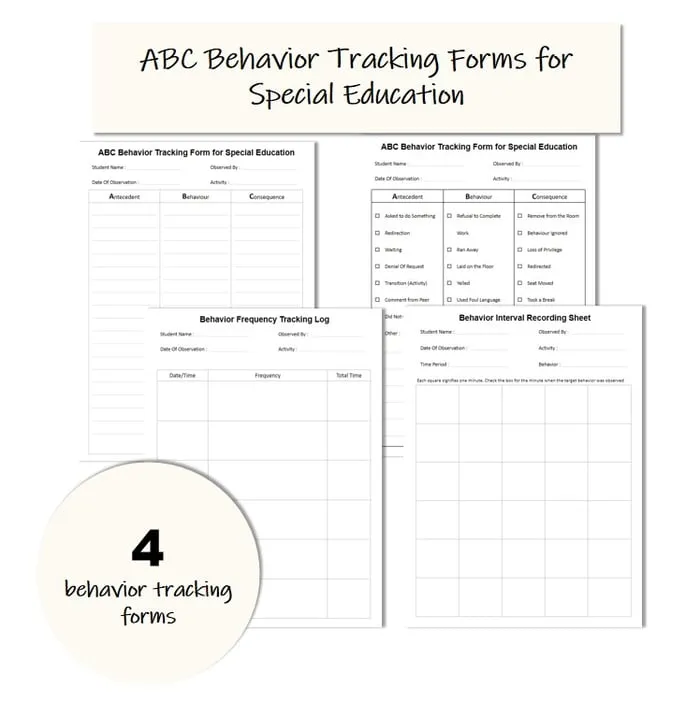
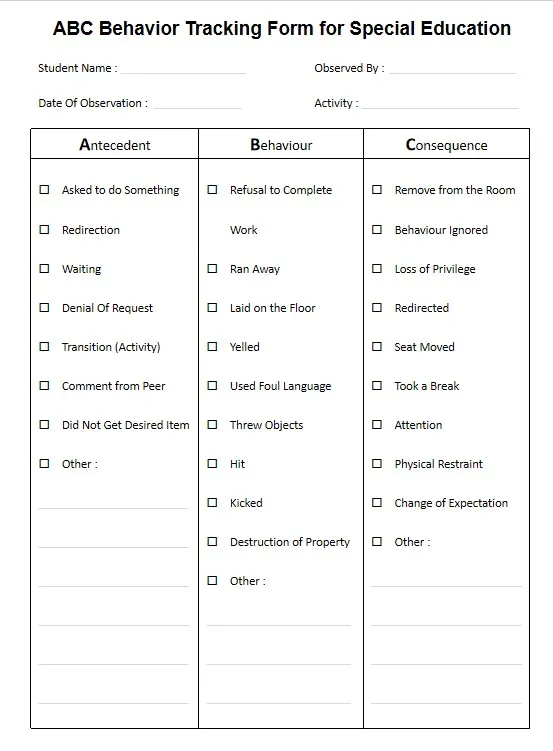
ABC Behavior Tracking Forms: Frequency & Interval Data Collection: four ready-to-use forms, including a checklist-style ABC form, a blank ABC form, a behavior frequency tracking log, and a minute-by-minute interval recording sheet.
Sources and scope
- IRIS Center, Vanderbilt University: free modules on behavior, data collection, and evidence-based practices.
- Center on PBIS: guidance on positive behavior support and data-based decision making in schools.
- Behavior Analyst Certification Board: the credentialing body for behavior analysts.
- IDEA, U.S. Department of Education: the law behind special education services, IEPs, and behavior supports.
This guide covers practical classroom data collection for teachers and support staff. It does not replace a functional behavior assessment or the advice of a qualified behavior professional. Instead, it helps you bring cleaner, clearer data to the people who make those decisions with you.
Key takeaways
- Frequency and interval recording begin with one clear, observable definition.
- Count short behaviors and use intervals for behaviors that last.
- Keep sessions short, consistent, and on the same form.
- Pair the numbers with a few ABC notes for context.
- Review the trend every two to three weeks and change one thing at a time.








Leave a Comment