

An ABC behavior chart is often the tool that turns “he does this all the time” into a pattern you can actually act on. Picture a third grader who tears up his worksheet two or three times a week. The team has tried reminders, a seat change, and a sticker chart, yet nobody can say exactly when or why it happens.
This guide shows you how to use an ABC behavior chart in five clear steps: define the behavior, set up the chart, record each incident objectively, find patterns, and turn those patterns into a plan you review. By the end, you will know how to collect behavior data that explains the why, not just the what.
Examples are fictional. Adapt to the student’s goals and agreed supports. This is guidance, not a diagnosis.
At a glance
- ABC stands for antecedent, behavior, and consequence: what happened before, during, and after.
- Define one behavior clearly before you start recording.
- Write what you see and hear, not what you think the student feels.
- Look for patterns after enough entries, usually across several days and settings.
- Use the patterns to change the setting and teach a replacement skill.
1. Define the behavior before you open the ABC behavior chart
First, decide exactly what you are tracking. An ABC behavior chart only works when every adult records the same behavior. Words like “defiant,” “disruptive,” or “upset” mean different things to different people, so they lead to messy data.
Instead, write an operational definition. A good definition describes the behavior so clearly that two adults watching the same moment would both record it. It names the action, and it says what counts and what does not.
| Vague label | Clear definition |
|---|---|
| Defiant | Says “no” and does not start the task within 2 minutes |
| Aggressive | Hits, kicks, or pushes another person |
| Disruptive | Calls out more than once during a lesson |
| Destroys work | Tears, crumples, or throws a worksheet |
Also, track only one or two behaviors at a time. If you try to record everything, you will record nothing well. Pick the behavior that most affects learning or safety.
In addition, take a quick look at how often the behavior happens now. A rough count from the past week gives you a starting point. Later, you can compare the ABC behavior chart data against this starting point and see whether things are changing.
Finally, share the definition with everyone who works with the student, including specials teachers and substitutes. A one-line definition taped inside the clipboard keeps entries consistent even on busy days.
Worked example. Leo is a fictional student in grade 3. His team agrees on one definition: “Leo tears, crumples, or throws his worksheet.” Talking back and leaving his seat are real concerns, but they are not tracked yet. As a result, everyone knows exactly what goes on the ABC behavior chart.
2. Set up the ABC behavior chart
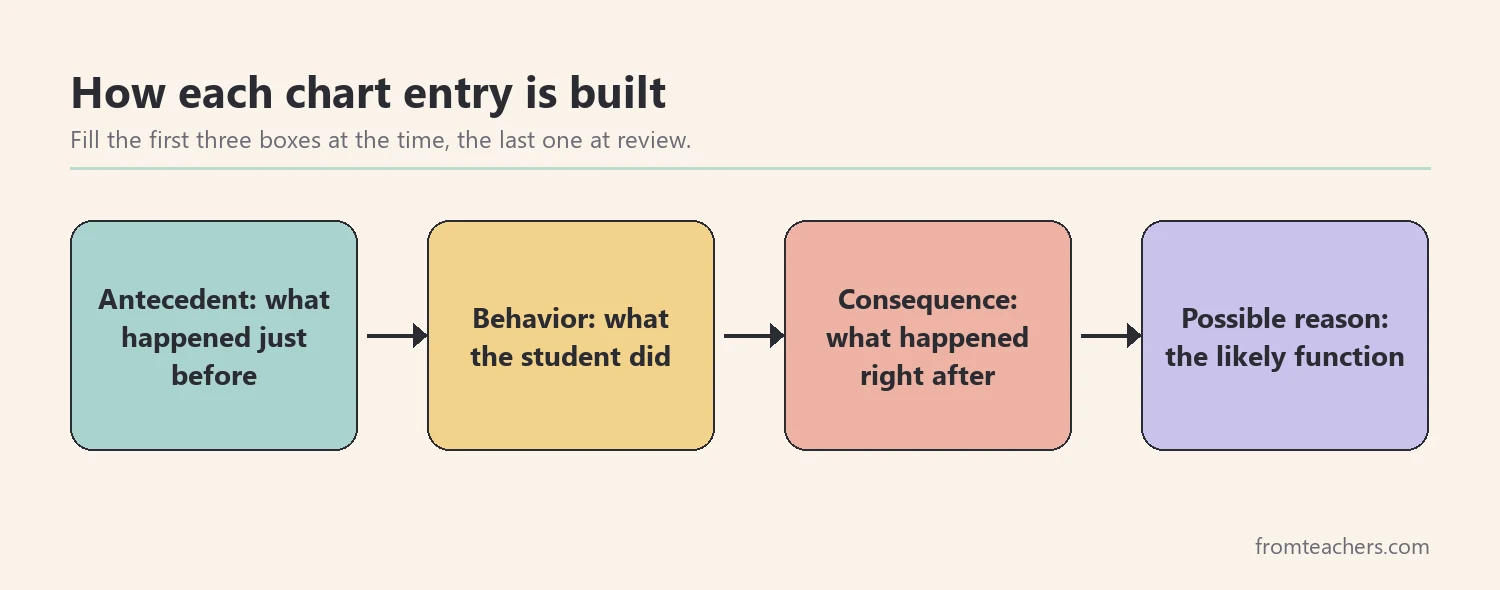
Next, prepare a chart that is quick to fill in. A busy adult has only a minute or two after an incident, so the layout must make the right information easy to write. Most charts use five columns.
- Time and place: when and where the behavior happened.
- Antecedent: what happened just before the behavior.
- Behavior: what the student did, in observable words.
- Consequence: what happened right after, including adult and peer responses.
- Possible reason: a short guess at the function, filled in later.
Then, decide where the chart lives. Keep one copy in a clipboard near the student’s area and one for any adult who works with him in other rooms. In addition, agree on who records, so incidents are not missed or written twice.
If you do not want to design the layout yourself, a printable ABC behavior chart with time, antecedent, behavior, consequence, and possible reason columns gives the team one consistent format, plus a filled-in example row to model good entries.
Worked example. Leo’s teacher keeps a chart on a clipboard by her small group table. The art and music teachers each get a copy for their rooms. The classroom aide is the main recorder, and the teacher fills in any incident the aide misses.
Because Leo moves between rooms, the team also agrees to return all copies to one folder each Friday. That way, no entries are lost, and the full week is ready to read together.
3. Record each incident objectively
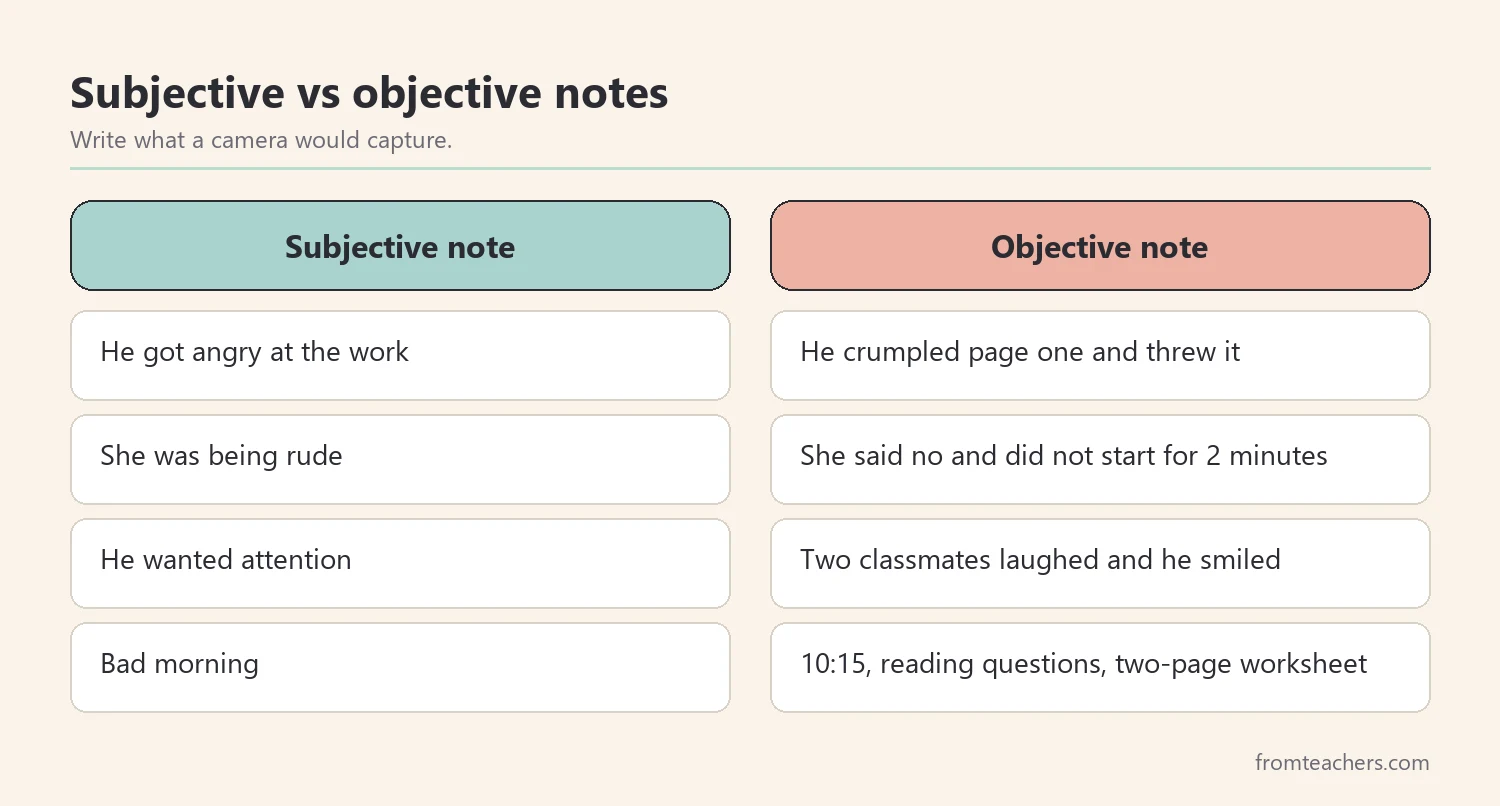
Now the real work begins. Each entry on the ABC behavior chart should read like a short video description. Write what a camera would capture: words spoken, actions taken, and the exact task. Leave out guesses about feelings or motives in the first three columns.
Also, write the entry as soon as you safely can. Memory fades fast, and details like “after the second set of directions” are easy to lose by lunchtime. A short, accurate note beats a long note written at the end of the day.
Recording checklist
- Note the time, the place, and the activity.
- Describe the antecedent in one sentence.
- Describe the behavior with action words from the definition.
- Record every response, from adults and from peers.
- Leave the possible reason blank until you review.
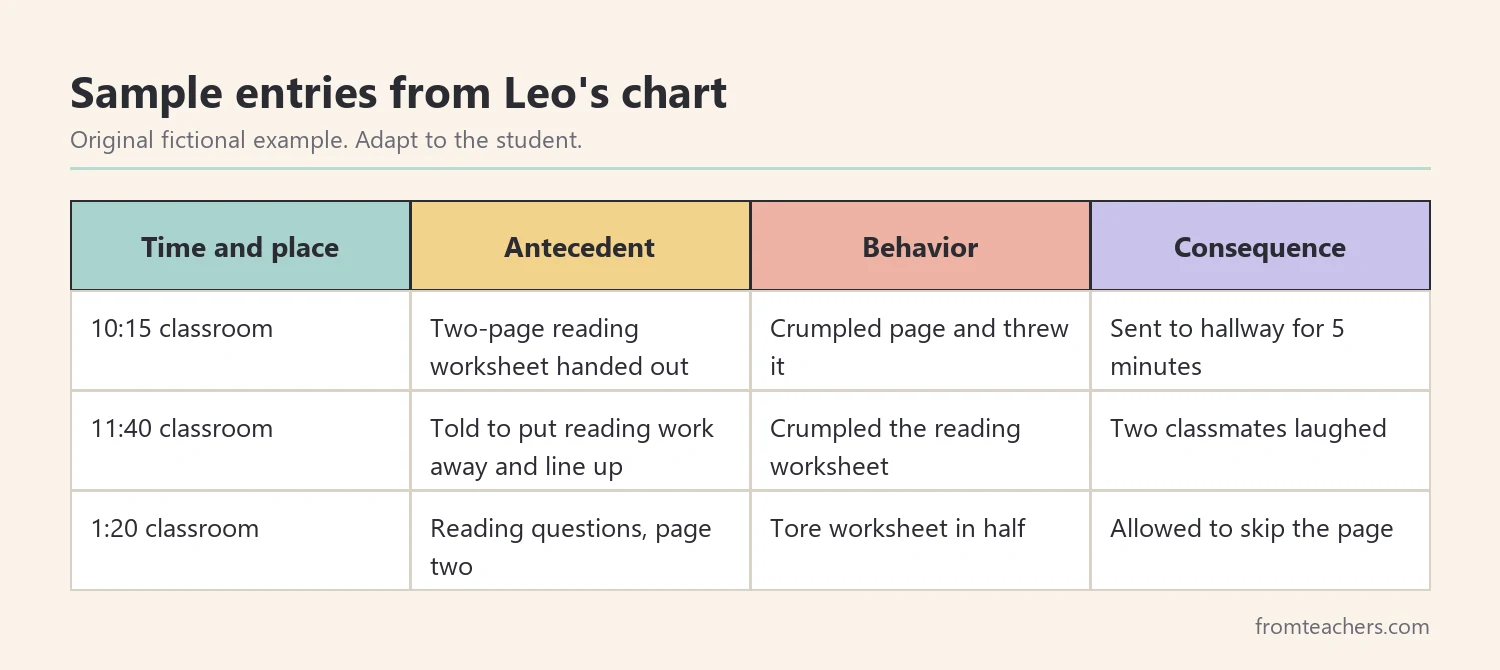
Worked example. One of Leo’s entries reads: “10:15, classroom, independent reading questions. Teacher handed out a two-page worksheet. Leo crumpled page one and threw it on the floor. Aide picked it up and sent Leo to the hallway for five minutes.” There is no “Leo was angry” and no “Leo wanted attention.” Those ideas come later, after the team looks at many entries.
Moreover, notice that the consequence column records the hallway time, not just the behavior. That small detail matters. Without it, the team might miss that each incident ended with Leo leaving the work, which turns out to be the key to the whole pattern.
4. Find patterns in the ABC behavior chart
After several days of entries, step back and read them together. One entry tells a story. Ten or more entries can show a pattern. Look across the rows rather than at any single moment.
First, count antecedents. Do most incidents happen during one type of task, one time of day, or one transition? Next, count consequences. Does the behavior usually end with the task removed, with adult attention, with peer laughter, or with access to something the student wants?
Then, fill in the possible reason column. Common functions include escaping a task, getting attention, getting an item or activity, and sensory needs. Treat your answer as a hypothesis. It is the team’s best guess, and the next step will test it.
Questions to ask the data
- Which task, time, or place shows up most often?
- What usually happens right after the behavior?
- Are there days or settings with no incidents at all?
- Did anything outside school, such as a poor night’s sleep, show up in the notes?
Also, pay attention to the quiet times. If the ABC behavior chart shows no incidents during hands-on science, that tells you something useful about what works for this student.
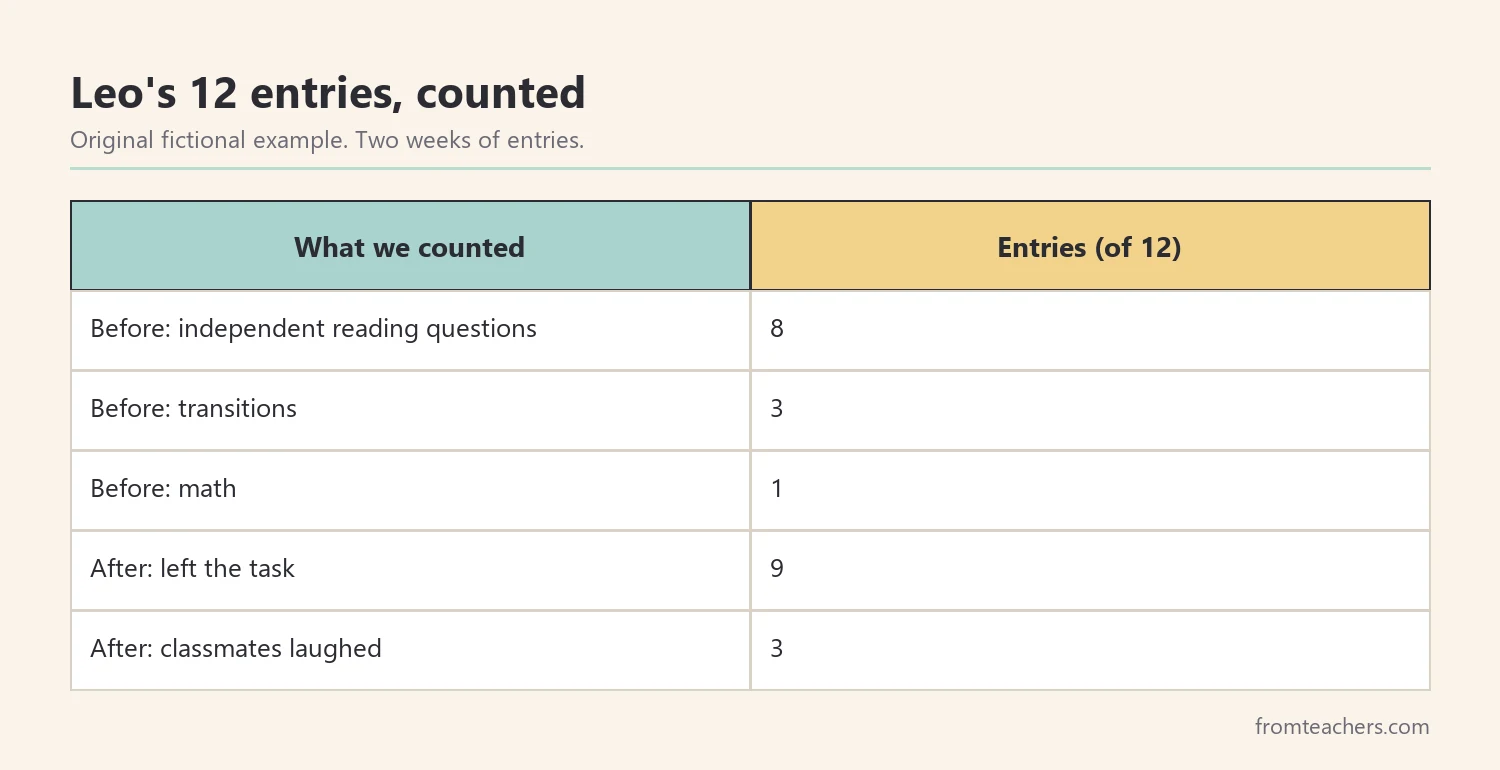
Worked example. Over two weeks, Leo’s ABC behavior chart has 12 entries. Of these, 8 happened during independent reading questions, 3 during transitions, and 1 during math. In 9 of the 12 entries, Leo ended up out of the task, either sent to the hallway or allowed to skip the page. The other 3 ended with classmates laughing. The team’s hypothesis: tearing the worksheet helps Leo escape long independent reading work.
In short, the chart did not just count incidents. It pointed to a specific task and a likely reason.
5. Turn patterns into a plan and review
Finally, use what the ABC behavior chart shows to change the plan. A good plan works on all three parts: change the antecedent so the behavior is less likely, teach a replacement behavior that meets the same need, and change the consequence so the old behavior no longer pays off.
| Part | Change for Leo |
|---|---|
| Antecedent | One page at a time, with the first question started together |
| Replacement | Ask for help with a card or ask for a short break |
| Consequence | Help or a short break when he asks; work stays when he tears it |
Next, keep using the chart while the new plan runs. The same format now shows whether incidents drop and whether the replacement skill appears. In addition, the data give you something concrete to share at an IEP meeting or with the family.
Then, set a review date, usually two to four weeks out. If incidents fall, keep the plan and slowly stretch the work. If they do not, check whether the plan was used as written and whether the hypothesis still fits.
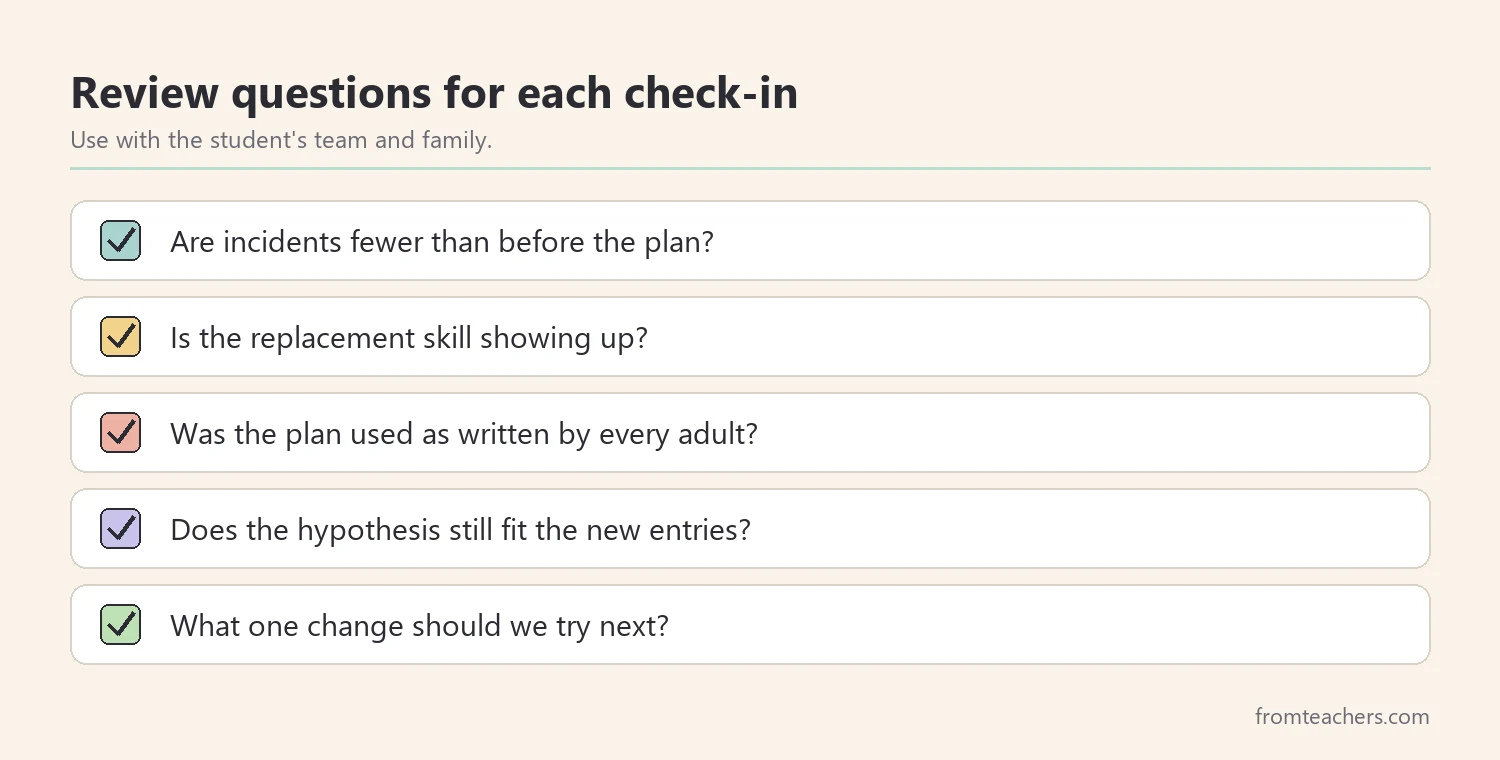
Worked example. Leo now gets one page at a time and a help card on his desk. In week 1 of the new plan, his chart shows 3 torn worksheets and 2 help card uses. By week 3, it shows 1 torn worksheet and 5 help card uses. The team keeps the plan and adds a second page back to the task in week 4.
Equally important, the team shares a one-page summary of the chart with Leo’s family. His parents notice that homework goes better when they also break reading into short parts. Now home and school use the same approach, and the ABC behavior chart keeps showing progress in both places.
Common mistakes and how to avoid them
- Tracking a vague behavior. “Misbehaving” cannot be counted. Write a clear definition before the first entry.
- Writing feelings instead of actions. “He was frustrated” is a guess. Describe what you saw and heard instead.
- Skipping the consequence column. What happens after the behavior often explains why it keeps happening. Record every response, even small ones.
- Deciding the reason too soon. One or two entries can mislead. Wait until you have enough entries across days and settings.
- Stopping the chart when the plan starts. Without ongoing data, you cannot tell whether the plan works. Keep recording through the review.
Questions teachers and parents ask about the ABC behavior chart
How many entries do I need before looking for patterns?
There is no fixed number, but more entries across different days and settings give a clearer picture. Many teams look after about two weeks of regular recording. If the behavior is rare, you may need longer.
Can parents use an ABC behavior chart at home?
Yes. The same columns work at home for moments like bedtime, homework, or getting ready in the morning. Sharing home and school charts can help the team see whether the pattern is the same in both places.
Is an ABC behavior chart the same as an FBA?
No. An ABC chart is one tool for collecting information. A functional behavior assessment is a broader process led by the student’s team, and it often includes ABC data, interviews, and other observations.
Who should fill in the chart?
Any adult who sees the behavior can record it, including teachers, paraprofessionals, and specialists. However, agree on one main recorder for each setting so entries are complete and not duplicated.
What if the behavior happens too often to record every time?
Record during set time blocks instead, such as the first reading lesson each day. Note the blocks you used, so the team reads the data correctly.
Related reading: The Power of Data Tracking in Special Education, Moving Beyond Shame and Behavior Charts: Positive Alternatives for Effective Classroom Management, and Meltdowns vs Tantrums: A Guide to Understanding and Responding.
A companion resource for the ABC behavior chart:
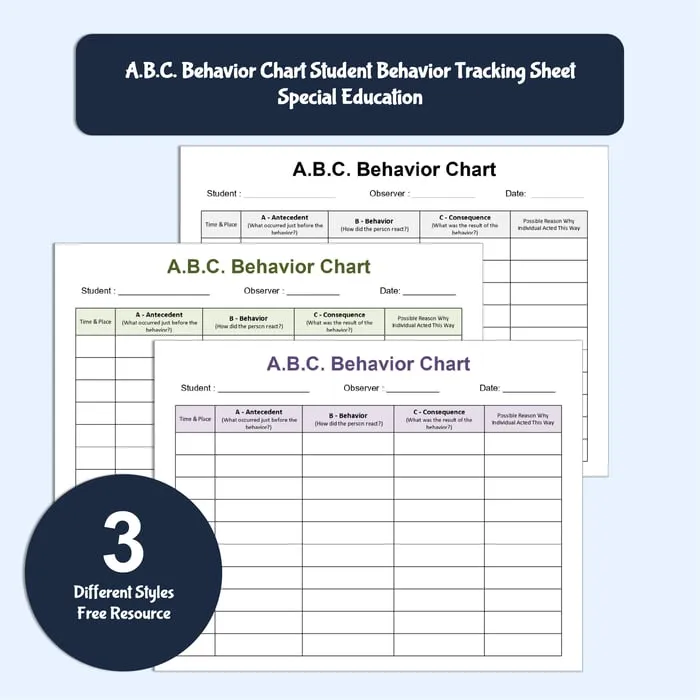
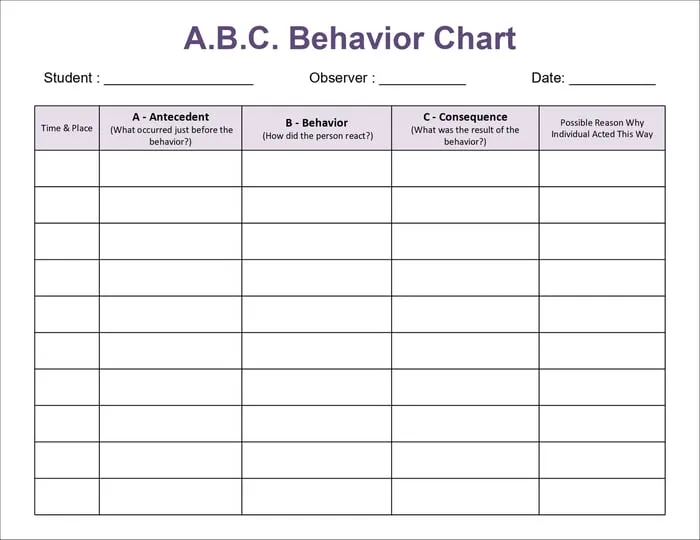
ABC Behavior Chart: Student Tracking Sheet: a printable sheet with columns for time and place, antecedent, behavior, consequence, and possible reason, one filled-in example row, and three color styles (navy, green, and purple) for FBA data collection or daily incident logs.
Sources and scope
- IRIS Center, Vanderbilt University: free modules on functional behavior assessment and classroom behavior.
- Center on PBIS: resources on positive behavior support and using data in schools.
- IDEA, U.S. Department of Education: the law behind special education services and behavior supports in IEPs.
- Understood.org: practical articles for families and teachers on behavior and learning differences.
This guide covers how to collect and read ABC data in classrooms and at home. It does not replace a formal functional behavior assessment or clinical advice, which belong to qualified professionals and the student’s team.
Key takeaways
- An ABC behavior chart records what happens before, during, and after a behavior.
- Start with one clearly defined behavior that every adult can recognize.
- Write objective entries quickly, and record every response.
- Count antecedents and consequences across many entries to form a hypothesis.
- Use the ABC behavior chart to test the new plan and review it on a set date.










Leave a Comment